
Learn how to understand chewiness/bite force graphs
 2 minute read
Whether it's the satisfying resistance of a chewy granola bar or the clean snap of a crisp vegetable, bite force influences mouthfeel, satisfaction, and overall enjoyment. These mechanical properties help define product identity — a chewy sweet should stretch and resist breaking easily, while a firm meat alternative must provide a consistent bite. Measuring chewiness and bite force provides manufacturers with essential data for ensuring product quality, replicating desired textures, and aligning with consumer expectations across a range of applications.
Using a range of blade options which attach to the arm of the instrument, this is a property where the Texture Analyser excels in measurement. Exponent software controls the distance that the blade comes down onto/into the sample to achieve the ‘biting’ action, as if the teeth were in alignment, hence mimicking the action of a consumer.
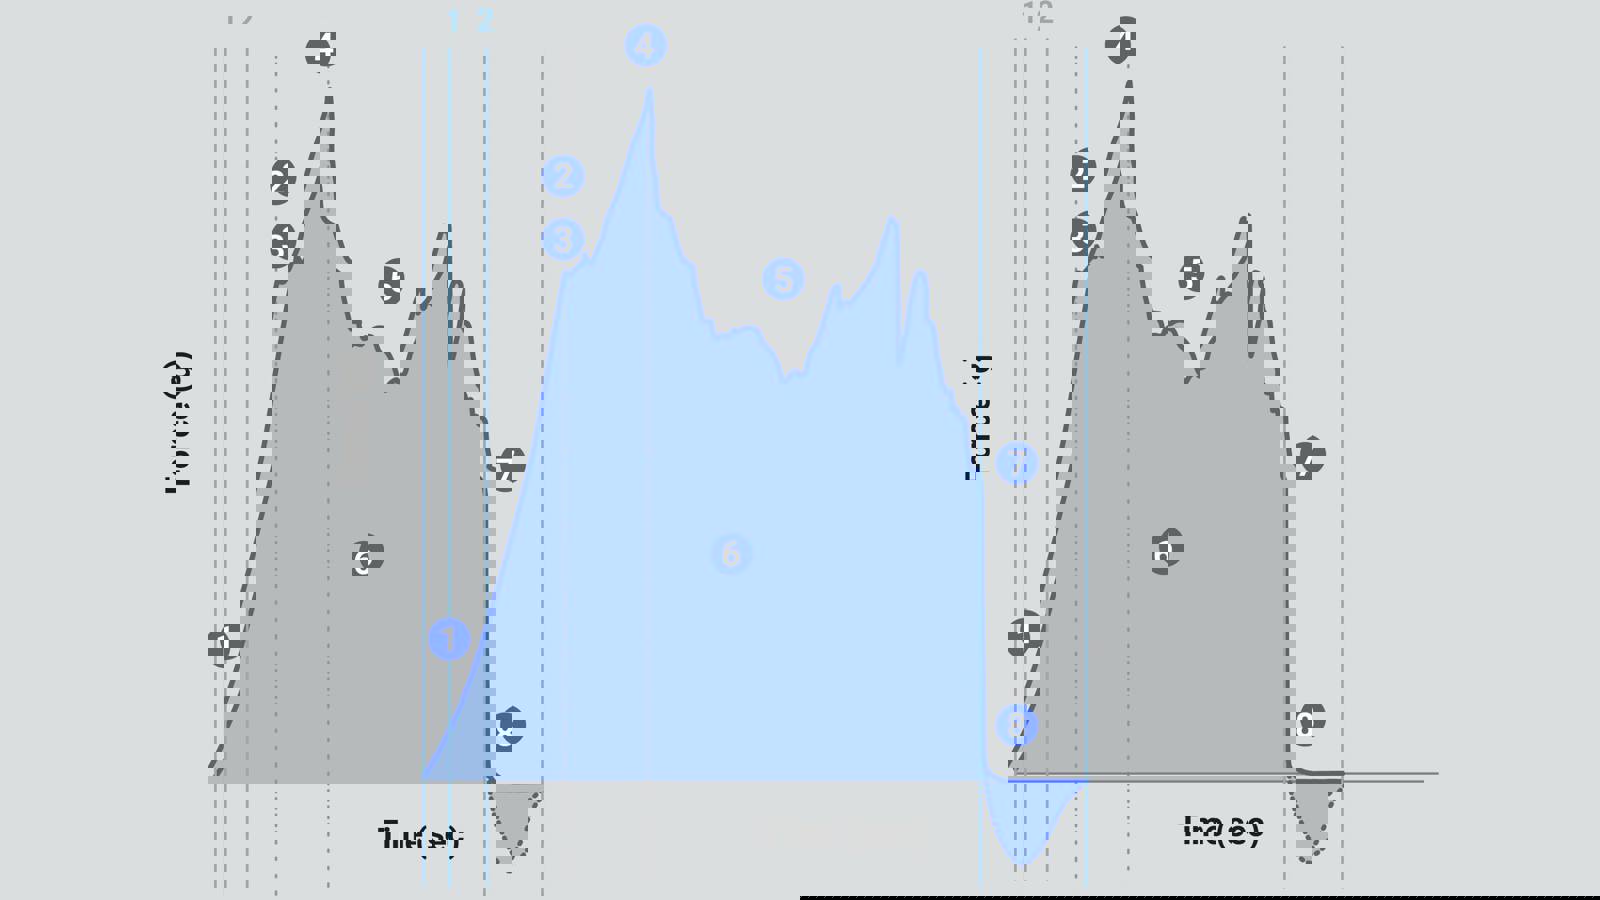
Once the test is performed, a graph is displayed that can be analysed to understand the chewiness characteristics of a sample. In our quest to help you understand how to interpret this type of curve we have prepared an animation that will take you through each test stage and explain the action of the blade attachment and the resulting sample behaviour. Each stage shows what to take from the graph for analysis and what it means.
Chewiness/bite force test: How to analyse the key features of a graph measuring chewiness/bite force
It's important to note that the specific shape of the graph will depend on the test settings, the type of sample being analysed, and the conditions under which the sample is evaluated. Varying behaviours are possible and specific applications may require tailored testing and analysis protocols to capture the relevant performance characteristics.
Learn about cutting/shearing testing, when to use this test type and the typical probes and fixtures for use on your Texture Analyser.


