


The measurement of sound
Acoustic data is measured and displayed in Exponent software in real time alongside mechanical measurements (force, distance and time) to identify certain events during a test, e.g. the popping sound when a beverage can is opened or the break of a biscuit as it is snapped. This sound measurement provides another dimension of quantitative data on fractures or audible events that occur when a sample is deformed during testing.
Perhaps the most salient characteristic of crunchy and crispy foods is the sound emitted upon their disintegration/fracture during chewing or in mechanical testing. When a crisp food is broken or crushed they invariably have a jagged stress-strain relationship. In addition, characteristic sounds are produced due to, for example, the brittle fracture of the cell walls of fruits or vegetables or the fracture of individual layers within a matrix product such as a crisp biscuit.
Sensory ‘crunchiness’ and ‘crispness’ are perceptions of not only force-deformation-time events but also, and almost certainly primarily, of their acoustic effects. It has been found, in fact, that the combination of acoustic and mechanical techniques more adequately describes food sensory perception than either technique alone.
The sound emitted from a product becomes its characteristic ‘acoustic signature’. The Acoustic Envelope Detector provides a tool for the quantification of this sound emission whilst measuring the textural properties of the product.
The application of sound measurement
Whilst much work in this area has focussed on measuring crispness of brittle foods like breakfast cereals, or potato chips or the crunch of a chewing gum tablet coating or fresh apple, potential applications include the quantification of:
- The ‘snap’ of a cracker/biscuit/chocolate bar (whilst measuring its breaking strength)
- The ‘pop’ of a cork (whilst measuring its ease of removal)
- The ‘fizz’ of a bath bomb or disintegrating tablet (whilst measuring its firmness)
- The ‘snap’ of a pencil (whilst measuring its breaking strength)
- The ‘click’ of a switch (whilst measuring its actuation force)
- The ‘crack’ of a Christmas cracker (whilst measuring its pull strength)
- The ‘zip’ of a zipper (whilst measuring its pull strength)

Advantages of this system
Unwanted background noise can be filtered out.
Force and sound graphs from individual tests are automatically synchronised so the relationship between acoustic and force events can then be easily identified.
Test data is saved as small files typically less than 200KB (dependent on length of test).
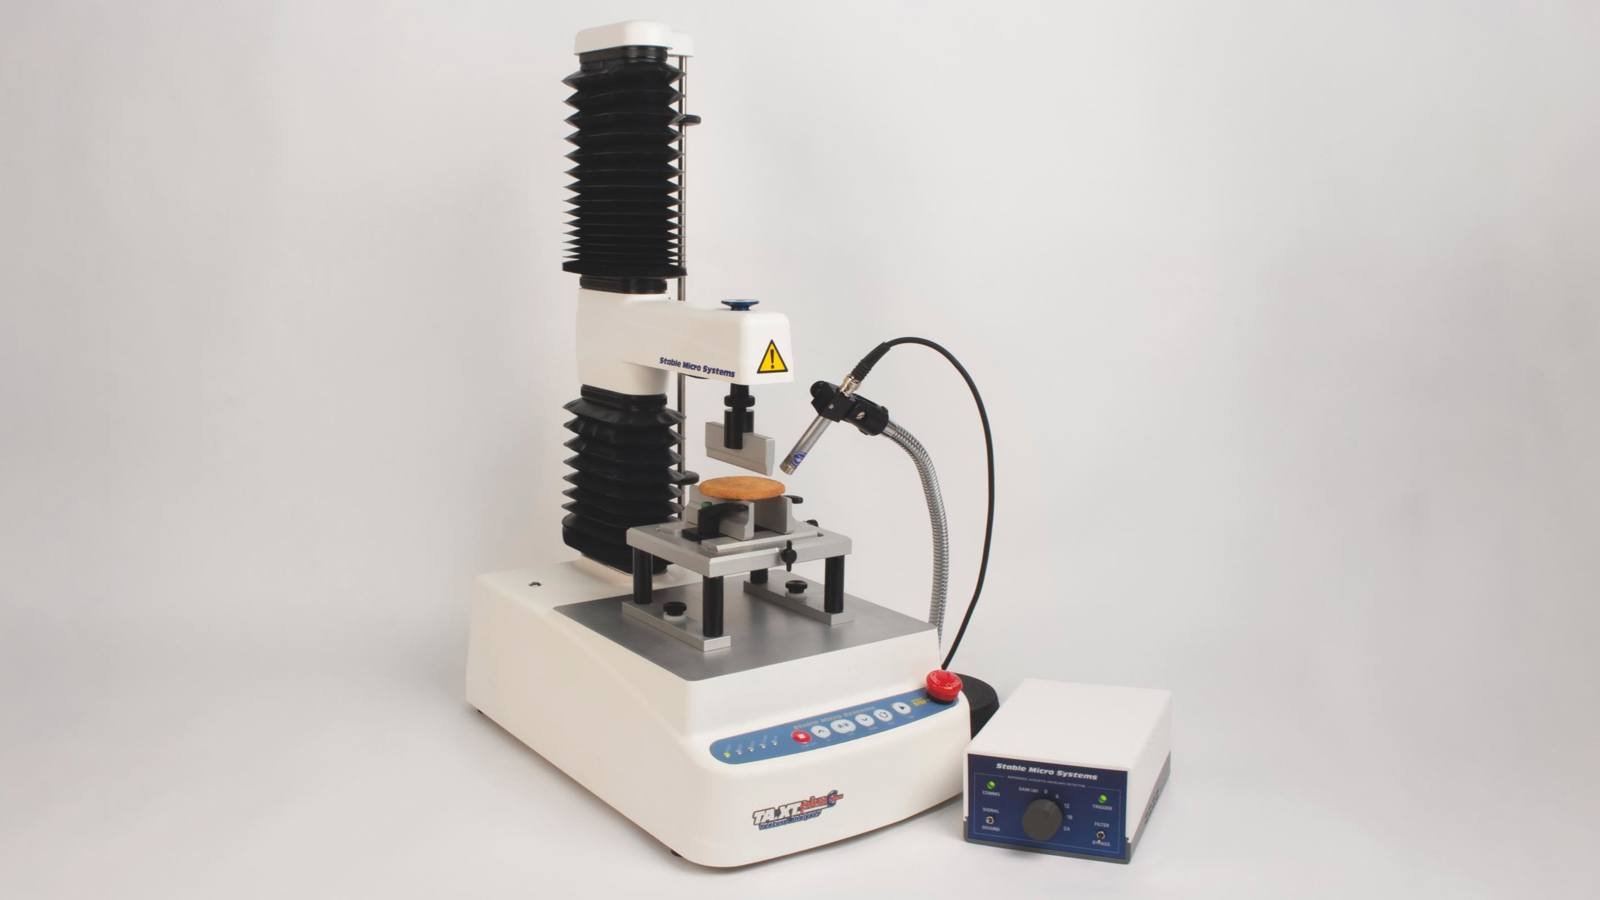
How the Acoustic Envelope Detector works
A calibratable microphone, positioned close to the sample, is attached to the AED unit which is connected to the Texture Analyser and transforms the sound into a varying voltage. The varying voltage represents the amount of acoustic energy released from a product during a test and is converted and displayed in decibels (dB), the standard measurement of sound.
The AED has been designed to have a high sensitivity to the frequencies emitted by crispy or crunchy products but has low sensitivity to mechanical noise emitted by the Texture Analyser and general background noise. It can, therefore, be used in a quiet laboratory without the need for an expensive acoustic chamber.
Collecting and displaying acoustic data
The AED has a user-specified audible bandwidth in the range of 1‑12kH to accurately detect the acoustic emissions from brittle products during deformation. This bandwidth is easily changed by selecting the required ‘corner frequency’ so that acoustic energy is measured over a smaller bandwidth.
Acoustic energy data is saved as part of a standard archive file. Acoustic and force curves can be stored together and viewed simultaneously so that the relationship between acoustic and force events can be easily identified and analysed.

Synchronised display of .wav files
The audio files (.wav files) are also recorded through the AED and displayed (Exponent Connect only) and are useful for several purposes.
The audio files greatly aid comprehension when analysing test results. Being able to hear the audio while seeing the audio data and Acoustic Envelope data helps the user to understand the nature of the data they are analysing.
Keeping the audio files from your tests allows a better comparison between different acoustic environments. One laboratory may have different background noise to another laboratory, and listening to the actual audio may allow you to easily identify this.
When analysing the test results, listening to the .wav files allows you to immediately hear whether there were unwanted background noises that have polluted your test data.
When setting up acoustic tests to compare products against previously stored test data, the ability to HEAR the test environment is useful to ensure the environment is acoustically similar.
When used with the Video Capture and Synchronisation System, the RAED Module provides the audio to accompany the video footage. The user then has Force, Video, Audio and Envelope data that may be studied together to provide a full understanding of the interaction between forces and noise produced from the breaking of a sample.
Technical information
How the Acoustic Envelope Detector allows choice of acoustic spectrum breadth
It is important to understand that the AED measures the total voltage over the set frequency range and converts this into decibels. This is illustrated in the diagram below.
 '1 frequency bin' from selected corner frequency to 12.5kHz
The AED uses a 1 ‘frequency bin’ approach that measures how the total acoustic energy within the set bandwidth varies with time. To focus on a specific frequency band a high pass programmable filter can be adjusted within the TA Settings window to alter the breadth of the acoustic spectrum from the lower end. There are 9 settings range from 1kHz to 10kHz. Note: the factory standard is set to 3kHz to reduce background noise.
What about background noise?
The frequency of sounds emitted from crispy materials spread across a large frequency range, up to and beyond the upper range of human hearing. The background noise of the Texture Analyser and general laboratory is mostly below 3kHz and can therefore be ignored as it does not contribute to the characteristic of crispy/crunchy acoustic events. Detailed research and analysis have enabled the design of a robust system that has low sensitivity to noise emitted by the Texture Analyser and general laboratories but a high sensitivity to the frequencies emitted by such crispy or crunchy products. This is effectively achieved by the use of the following:
- A high pass filter, easily configured by a drop-down menu in the test settings
- A directional microphone, mounted close to the sample
- Furthermore, automatic macros can be run on the data to assess the noise floor and a new data set can be generated without unwanted ‘signal noise’.
Technical specification
The reference system uses a highly sophisticated and sensitive microphone which is calibrated by the user to National Standards. This means that fundamental acoustic data is obtained and therefore results obtained at different times, locations or from different units or systems can be compared directly and accurately. Calibrator included.