Stable Micro Systems logo
Request a quote
  • Texture analysis
    • Texture Analysers
    • TA.XTplusC
    • TA.XTplus100C
    • TA.HDplusC
    • TA.XTExpressC
    • Compare Texture Analysers
    • Texture Analyser Buying Guide: 7 questions you need to ask
    • Software
    • Upgrades
    • Learn
    • Why measure texture?
    • How a Texture Analyser works
    • A beginner’s guide
    • What is food texture?
    • Texture Profile Analysis (TPA)
    • Texture analysis properties
    • Application areas
    • Speed up your testing
    • Case Studies
    • Attachments and accessories
    • Probes
    • Attachments
    • Acoustic Envelope Detector
    • Video Capture and Synchronisation System
    • Automated Linear Indexing System
    • Temperature Control
    • Dough Inflation System
    • Dynamic Integrated Balance
    • Penetrometer
    • IDDSI System
    • Egg Quality Testing System
    • Accessories
    • Custom design service
    • Test types
    • Penetration
    • Compression
    • Cutting/shearing
    • Extrusion
    • Fracture/bend
    • Tensile
    • Adhesion
    • Other test types
    • Applications
    • Food
      • Alternative proteins
      • Bakery
      • Cereals
      • Confectionery
      • Dairy
      • Gels and films
      • Fish
      • Fruit and vegetables
      • Meat
      • Pasta and noodles
      • Snacks
      • Petfood and animal feed
      • Powder and granules
    • Future and novel foods
      • 3D printed foods
      • Cell cultured foods
      • Foods containing CBD
      • Foods containing insects
      • Upcycled food
      • Vertically farmed foods
    • Reformulated foods
      • Free-from foods
      • Fortified foods
      • Low-in foods
      • Foods for dysphagia (IDDSI)
    • Materials and products
      • Adhesives
      • Electronics
      • Packaging
      • Gels and films
      • Innovative materials
      • Leather and textiles
      • Paper and cardboard
      • Polymers
      • Powder and granules
    • Pharmaceutical and medical
      • Dental
      • Medical devices
      • Pharmaceutical and medical
      • Pharmaceutical packaging
    • Cosmetics and personal care
      • Cosmetics and skincare
      • Personal care products
      • Hair and haircare products
    • Powders and granules
    • View all
  • Materials testing
    • Materials Testers
    • TA.HDplusC
    • TA.XTplus100C
    • Compare Materials Testers
    • Upgrades
    • Learn
    • What is materials testing?
    • Force testing
    • Materials testing properties
    • Application areas
    • Software
    • Case Studies
    • Attachments and accessories
    • Probes
    • Attachments
    • Acoustic Envelope Detector
    • Video Capture and Synchronisation System
    • Automated Linear Indexing System
    • Temperature Control
    • Dynamic Integrated Balance
    • Penetrometer
    • Resistance Conversion Unit
    • Accessories
    • Custom design service
    • Test types
    • Penetration
    • Compression
    • Cutting/shearing
    • Extrusion
    • Fracture/bend
    • Tensile
    • Adhesion
    • Other test types
    • Applications
    • Materials and products
      • Adhesives
      • Electronics
      • Packaging
      • Gels and films
      • Innovative materials
      • Leather and textiles
      • Paper and cardboard
      • Polymers
      • Powder and granules
    • Pharmaceutical and medical
      • Dental
      • Medical devices
      • Pharmaceutical and medical
      • Pharmaceutical packaging
    • Cosmetics and personal care
      • Cosmetics and skincare
      • Personal care products
      • Hair and hair products
    • View all
  • Volume and density
    • Volscan Profiler
    • Volscan Profiler instrument
    • How the Volscan Profiler works
    • Measuring volume and density
    • Software
    • Technical specification
    • Accessories
    • Case Studies
    • Applications
    • Bakery
    • Eggs
    • Other foods
    • Materials
    • Hair
    • Ceramscan
    • Ceramscan instrument
    • How the Ceramscan works
    • Measuring ceramic density
    • Ceramic and advanced material tests
    • Software
    • Technical specification
    • Ceramscan Validation
  • Powder flow
    • Products
    • Powder Flow Analyser
    • TA.XTplusC Texture Analyser
    • Learn
    • How a PFA Works
    • Why measure powder flow?
    • Other powder related tests
    • Software
    • Technical specification
    • Industry examples
    • Case studies
  • Applications
    • Food
    • Alternative proteins
    • Bakery
    • Cereals
    • Confectionery
    • Dairy
    • Gels and films
    • Fish
    • Fruit and vegetables
    • Meat
    • Pasta and noodles
    • Snacks
    • Petfood and animal feed
    • Powder and granules
    • Future and novel foods
    • 3D printed foods
    • Cell cultured foods
    • Foods containing CBD
    • Foods containing insects
    • Upcycled food
    • Vertically farmed foods
    • Reformulated foods
    • Free-from foods
    • Fortified foods
    • Low-in foods
    • Foods for dysphagia (IDDSI)
    • Materials and products
    • Adhesives
    • Electronics
    • Packaging
    • Gels and films
    • Innovative materials
    • Leather and textiles
    • Paper and cardboard
    • Polymers
    • Powder and granules
    • Pharmaceutical and medical
    • Dental
    • Medical devices
    • Pharmaceutical and medical
    • Pharmaceutical packaging
    • Cosmetics and personal care
    • Cosmetics and skincare
    • Personal care products
    • Hair and haircare products
  • Discover
    • Resources
    • Blog
    • Request a brochure
    • Request an article
    • Published references
    • Recommended literature
    • YouTube channel
    • Subscribe to our newsletter
    • FAQs
    • Case studies
    • Food
    • Materials
    • Pharmaceutical and medical
    • Cosmetics, skincare and haircare
    • Volume and density
    • Powder flow
    • About us
    • Company profile
    • Why we are world leaders
    • Careers
    • News
  • Support
    • General
    • Software updates
    • Register a product
    • FAQs
    • Correct use of TPA
    • Glossary
    • User support
    • Technical support form
    • Test advice service
    • Macro writing service
    • Get a new manual
    • Education Zone
    • Tips for Exponent Connect users
    • Training courses
    • Contact your local distributor
    • Product maintenance
    • Calibration
    • Upgrade your instrument
    • UK maintenance plan
    • Latest news
    • Products
    • Research
    • Patents
    • Texture
    • Subscribe to our newsletter
  • Contact
    • Contact details
    • Find a distributor
    • Request a demonstration
    • Request a quote
    • Events and seminars
Request a quote

How to measure toughness/cutting force

Toughness/cutting force: definition and importance Further example applications of toughness and cutting force testing Typical probe/attachment used for measurement Typical graphs How to interpret the Texture Analyser graph Key factors affecting cutting force/toughness measurement Optimising abrasion measurement and analysis: The Stable Micro Systems advantage
Person slicing raw meat

Toughness/cutting force: definition and importance

Cutting force refers to the effort required to push a blade through a sample.  It is influenced by a material’s firmness, hardness, or toughness (as well as, of course, the sharpness and geometry of the cutting tool). These terms are interchangeable based on the product being tested. Toughness, in particular, is a measure of how much energy is required to perform the cut, often represented as the total area under a force-distance curve. This property is important in evaluating product durability, processing behaviour, and consumer experience, and is essential for industries like food processing, pharmaceuticals, and materials science and is significant in industries like food processing, manufacturing, materials science, and packaging because they impact how a material can be manipulated, processed, and used. Toughness combines aspects of strength and ductility, meaning a material must be both strong and flexible to be tough.

Further example applications of toughness and cutting force testing

Cutting force and toughness measurements using a Texture Analyser allow industries to assess the resistance of materials to deformation and breaking. Below are key applications:

  • Food product toughness testing: Evaluating the toughness of meats, vegetables, and fruits by measuring the force needed to cut through them.
  • Bakery product cutting force analysis: Assessing the force required to slice bread, cakes, and pastries to evaluate their texture and cutting properties.
  • Pharmaceutical tablet toughness measurement: Testing the toughness of tablets by measuring the force needed to break or cut them, ensuring their integrity during handling.
  • Meat tenderisation force testing: Evaluating the force needed to shear or puncture meat to determine its tenderness after mechanical or enzymatic tenderisation.
  • Fruit peel toughness measurement: Measuring the force required to shear or puncture fruit peels, aiding in quality control and processing decisions.
  • Polymer film toughness testing: Evaluating the force required to cut or puncture polymer films used in packaging and industrial applications.
  • Candy and confectionery toughness evaluation: Measuring the force needed to cut or break candies like toffee or caramel to assess their texture and toughness.
  • Bone toughness measurement: Assessing the force required to fracture bone materials in medical applications like orthopaedics and dental implants.


In these examples, a Texture Analyser is used to apply controlled forces/distances to materials or products to assess their toughness and cutting properties. These measurements provide insights into material strength, durability, and performance in various applications.

Typical probe/attachment used for measurement

In a typical toughness/cutting force measurement, a sample is located beneath a blade/wire, usually perpendicularly. The test simulates the action of biting into a food product and measuring the force and distance required to cut through/penetrate or deform the sample relating to a sample’s toughness. A range of blade options provide a cutting edge which effectively represents a line of teeth.

Typical Cutting force measurement video with synchronised data collection

Stable Micro Systems’ range of blades vary considerably in size, material, thickness and sharpness. When a product is uniform (homogenous), a single blade test may be adequate for the repeatable assessment of the product.

Craft Knife Adapter and Blades

Person biting chewing gum pellet
Craft Knife on the Texture Analyser

Blade Set

Person cutting a piece of cooked steak
Cutting test using a Blade Set on the Texture Analyser
Child biting into a muffin
Cutting test using a Blade Set on the Texture Analyser

However, quite often a product is non-uniform (heterogeneous) in make-up. For example, cereal bars and are of different structure throughout their length. A single cutting test may encounter a peanut, toffee piece and hard wheat piece. The same cutting test done further down the length of the product will produce a different result; this time the blade may encounter a fruit piece and a chocolate chip. The same type of explanation can be given for a piece of meat.

To assess these types of product in a more reproducible way, the recommendation is to perform a multiple shearing test (most often using a Kramer Shear Cell). This test performs 5 or 10 cutting tests within one test and therefore creates an averaging effect.
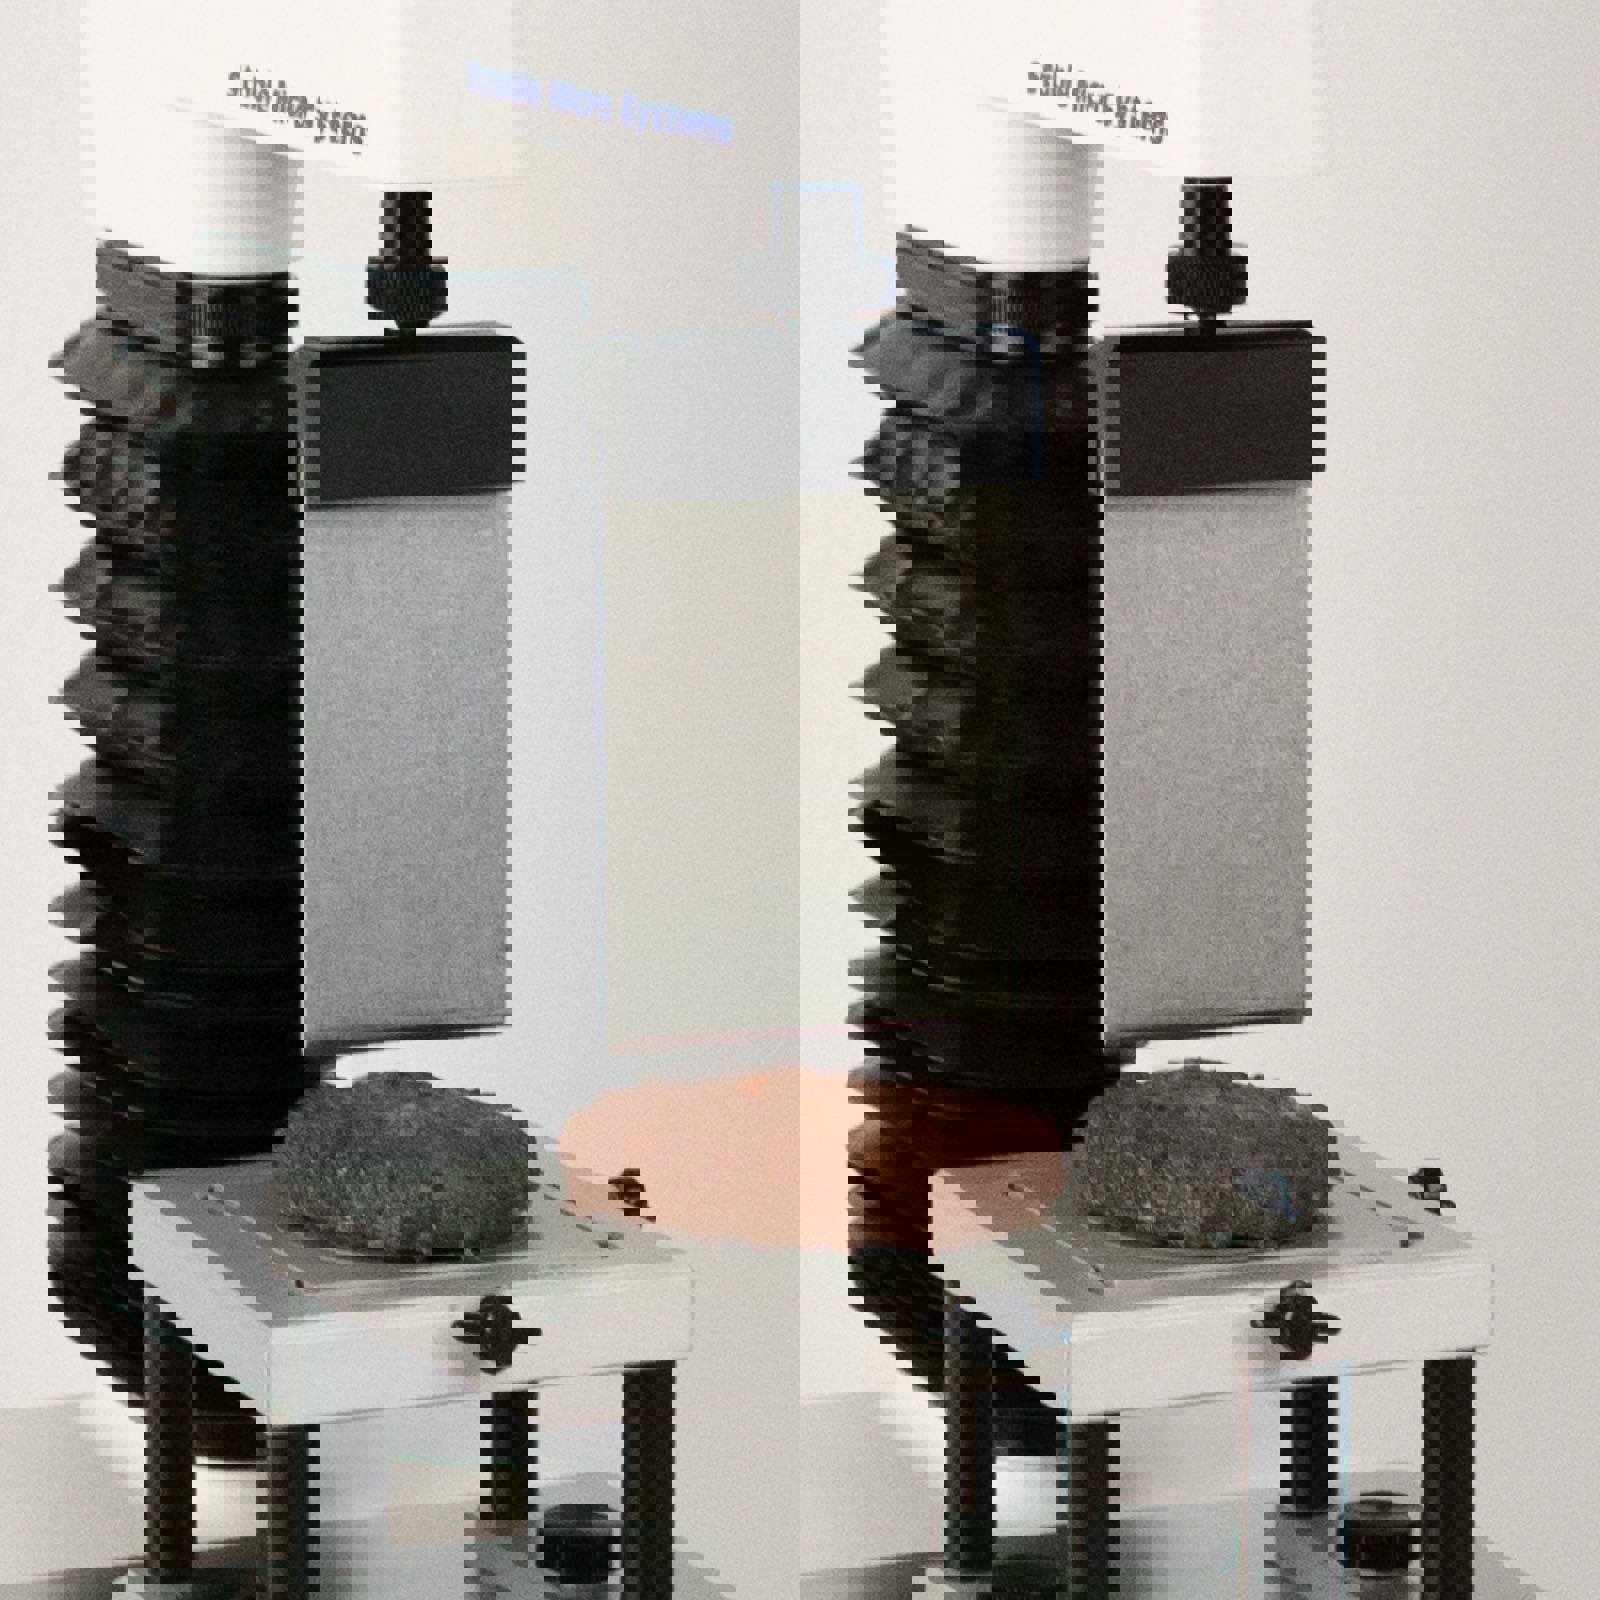
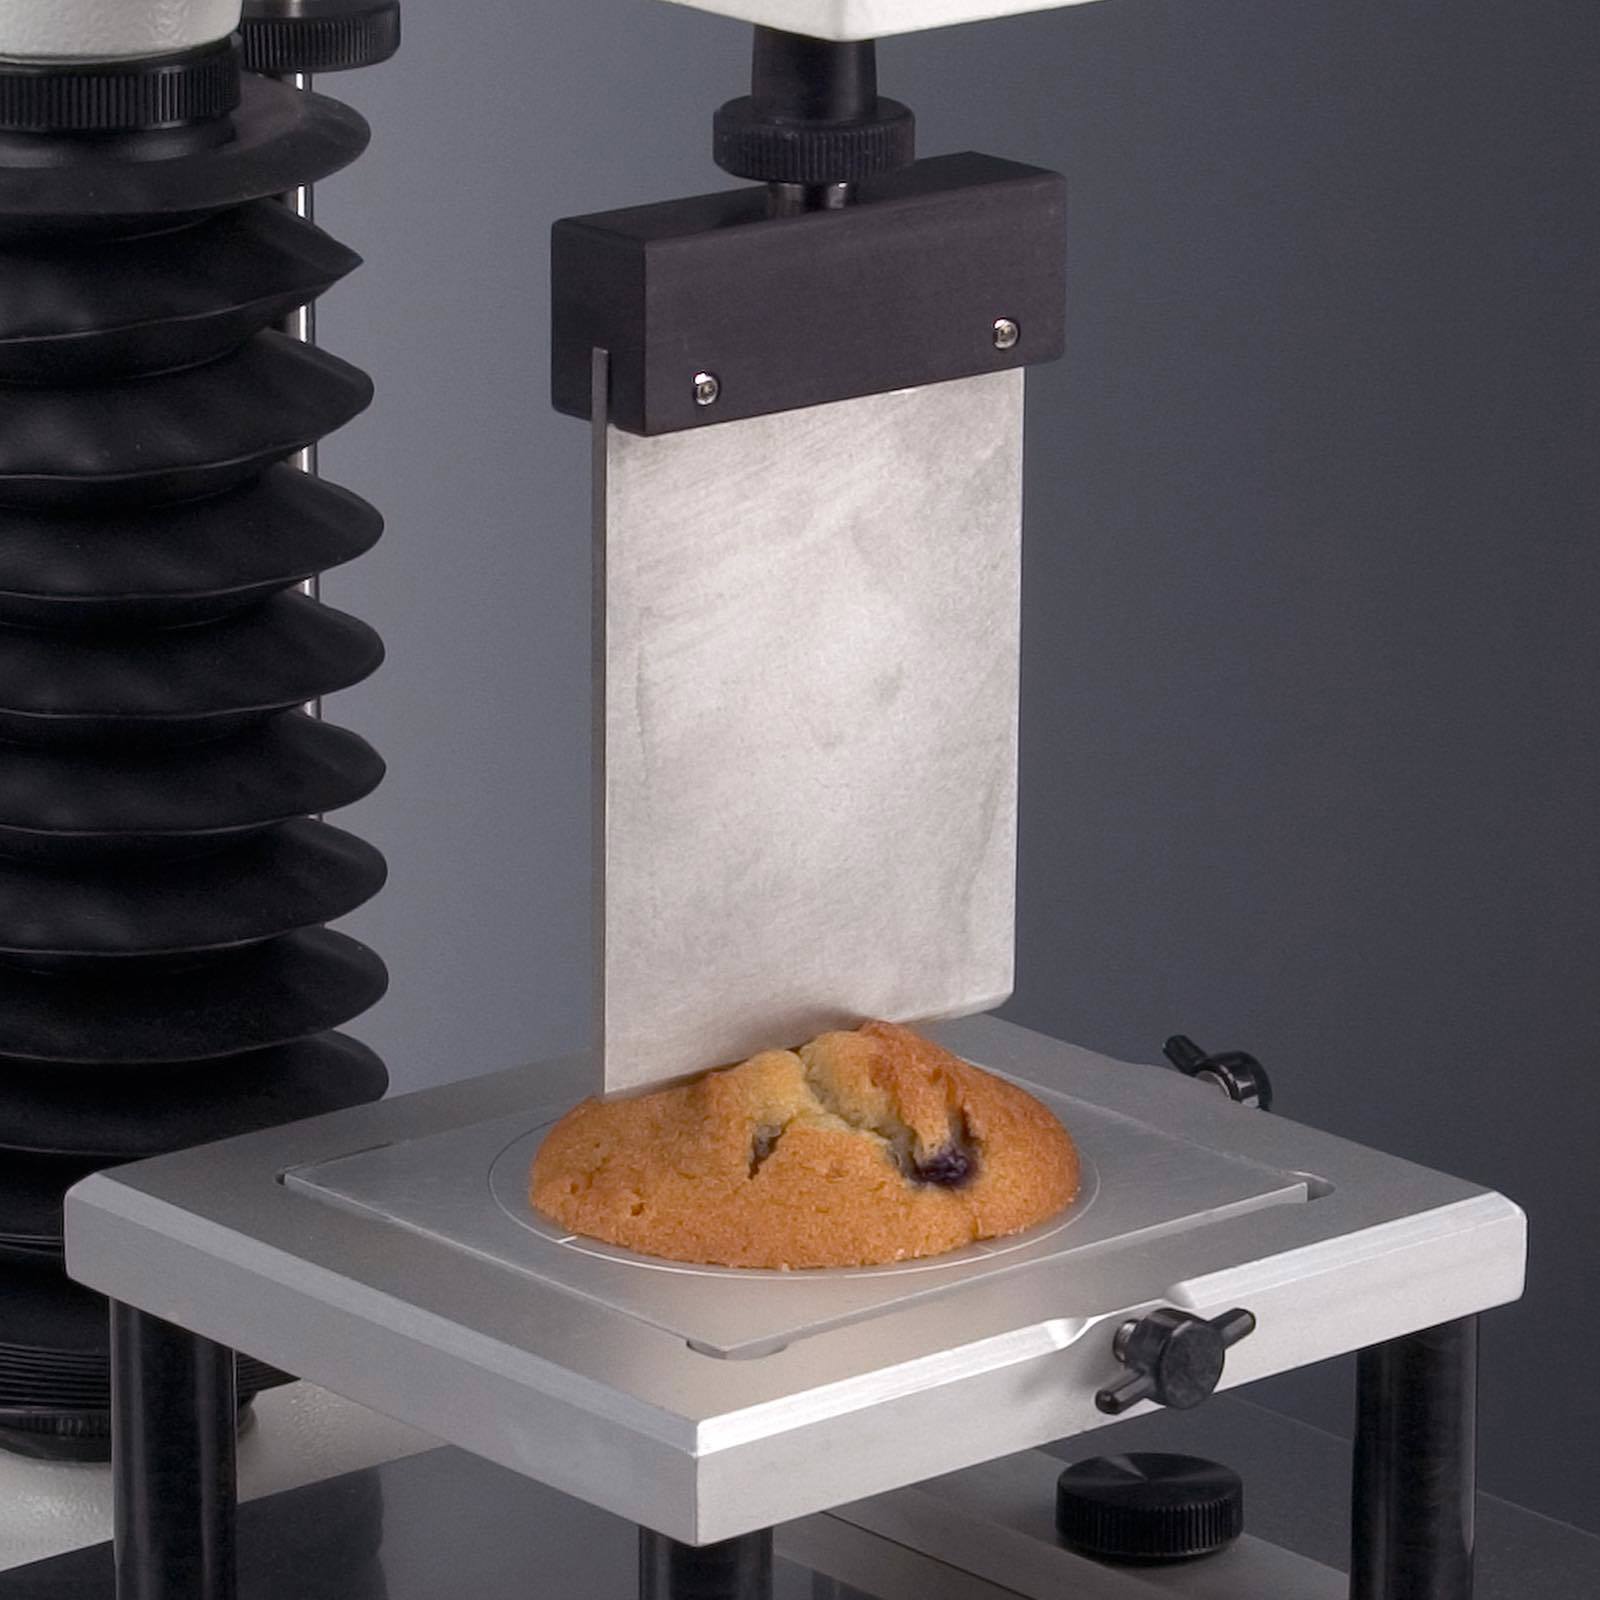
Cutting test on raw red meat using a Kramer Shear Cell Kramer Shear Cell

Typical graphs

Typical Texture Analyser graph comparison of non-homogeneous sausage shearing test
Typical Texture Analyser graph of homogeneous butter cutting using a Wire Cutter

How to interpret the Texture Analyser graph

When measuring toughness/cutting force (with a single or multiple blades), the force vs distance/time graph typically shows an undulating profile. Sharp, high peaks suggest crispness or brittleness. Multiple peaks suggest a heterogenous/variable texture. Broader, lower peaks might indicate a chewy or rubbery texture. From the graph you can observe/obtain the following:

  • Work of shear
  • Toughness
  • Chewiness
  • Biting force
  • Cutting force
  • Hardness
  • Firmness
Typical curve indicating key analysis points of a toughness test of a non-homogeneous sample Typical curve indicating key analysis points of a toughness test of a non-homogeneous sample
Typical curve indicating key analysis points of a toughness test of a homogeneous sample Typical curve indicating key analysis points of a toughness test of a homogeneous sample

A full explanation of this curve and its analysis can be accessed within Exponent Connect software. Existing Exponent users can upgrade to Exponent Connect specification

Below is a video example of how we can help you understand curve analysis for an example property. 

Typical animation explaining all parts of an chewiness/bite force curve (contained in Exponent Connect software for all properties)

Key factors affecting cutting force/toughness measurement

  • Temperature: Lower temperatures tend to reduce toughness, as materials become more brittle. Higher temperatures can increase toughness by allowing the material to deform more before breaking.
  • Strain rate/testing speed: The speed at which stress is applied can affect toughness. Materials may behave differently under slow, gradual stresses compared to sudden, high-speed impacts, especially viscoelastic materials.
  • Cutting attachment geometry: The sharpness and angle of the cutting tool affect cutting force. A sharper tool with an optimal cutting angle reduces the force needed to cut through the material.
  • Sample preparation: Consistent size and shape are crucial for accurate results.

Optimising abrasion measurement and analysis: The Stable Micro Systems advantage

The Stable Micro Systems Texture Analyser excels in optimising Cutting Force and Toughness measurements through its comprehensive approach and specialised features. It accurately quantifies multiple properties including work of shear, chewiness, biting force, hardness, and firmness, providing a holistic view of a product's cutting and toughness characteristics.

Equipped with a wide range of blades and cutting tools, from craft knives to the Kramer Shear Cell, it precisely measures cutting force across diverse products, from soft pastries to hard nuts. The Texture Analyser captures detailed force-time-distance profiles, enabling in-depth analysis of cutting behaviour and accurately measuring the effort required to cut through samples.

Advanced Exponent Connect software offers comprehensive data interpretation capabilities with customisable parameters. Backed by Stable Micro Systems' expertise in graphical interpretation and method development, makes the Texture Analyser the ideal choice for researchers and manufacturers seeking to refine product formulations and maintain quality standards in cutting force and toughness testing across various industries.

Widest Range Of Probes, Attachments And Accessories
Widest range of probes, attachments and accessories

Tooth-like tools for realistic bite simulation.

World Class Data Analysis Software
World class data analysis software

Detailed force-time-distance profiles providing multiple parameters.

Expanded Testing Possibilities
Customisable test parameters

Adjust settings to match specific product requirements or simulate real-world usage conditions.

Macro Icon
Collect 2000 points per second

High detailed graphs captured for in-depth analysis.

Test Advice Service Icon
Test advice

If you need help with your cutting force measurement, we offer unrivalled support.

Unrivalled Inbuilt Test Advice Library
Unrivalled inbuilt test advice library

Be guided through the steps to successful testing and analysis of toughness.

See all properties that can be measured

Contents

  • Toughness/cutting force: definition and importance
  • Further example applications of toughness and cutting force testing
  • Typical probe/attachment used for measurement
  • Typical graphs
  • How to interpret the Texture Analyser graph
  • Key factors affecting cutting force/toughness measurement
  • Optimising abrasion measurement and analysis: The Stable Micro Systems advantage

Learn more about measuring toughness/cutting force

Request a demonstration
Read published papers measuring this property
Request a probes and attachments brochure
Home
  • Contact
  • Send us an enquiry
  • Request a quote
  • Request a demonstration
  • Find a distributor
Head office

+44 (0) 1483 427345
Vienna Court, Lammas Road
Godalming, Surrey, GU7 1YL
United Kingdom

Subscribe to our newsletter
  • LinkedIn
  • YouTube
  • X (formerly Twitter)
  • Facebook
Copyright © 2025 Stable Micro Systems. All rights reserved. Privacy and cookie policy Sitemap