Powder Flow Analysis software and calibration
Take your testing further with the most comprehensive software in this field with unique features
Powerful software packed with functionality
Exponent Connect is a 32-bit software package which drives the TA.XTplusC and TA.HDplusC Texture Analysers on which the Powder Flow Analyser is located.
The software provides a flexible graphical user interface to choose test settings and acquire test data in a real-time graphical display. Macro and spreadsheet facilities are built-in to aid automated data collection and analysis with a wide range of data presentation formats.
Stable Micro Systems recognises the need to constantly increase the capability of Exponent Connect software by adding new testing procedures, analytical solutions and background support material. Exponent Connect software is written in-house giving us the ability to quickly add required features suggested by our users. We constantly strive for improvement and pride ourselves on our quality of customer support throughout the world.
The section below presents a few highlights of the software which can only be fully appreciated by a demonstration with one of our experts.
Unique software features
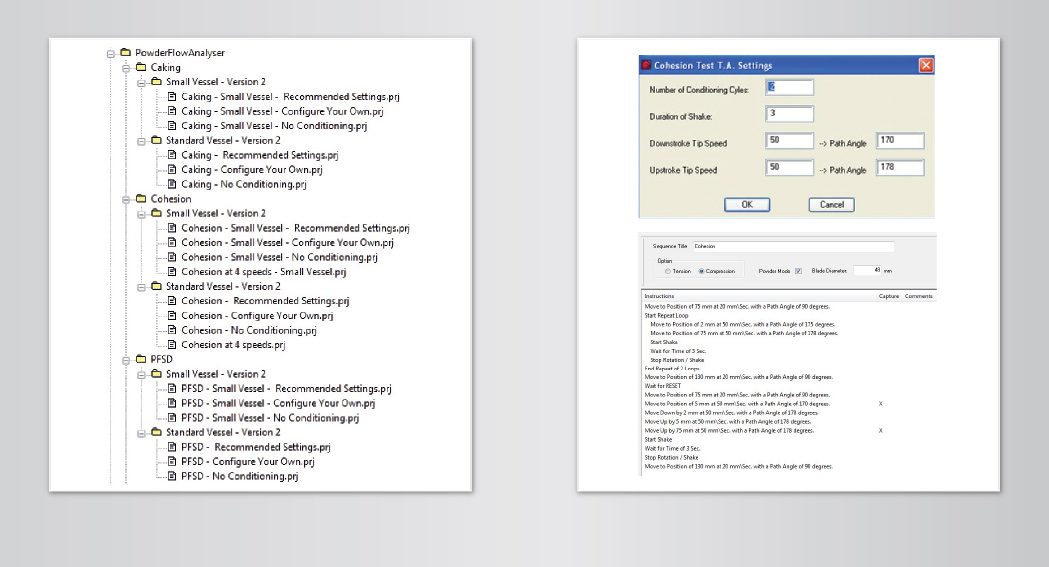
Simple: Loading of all project files at the click of a button
Customisable: Ability to modify test projects or design unique protocols step by step
Data Acquisition Rate: Data can be captured up to 2000 points per second (PPS)
Language Editor: Menu items and operator messages can be easily converted into your own language using a provided plug-in tool for language editing.
Additional data collection: Humidity, temperature and acoustic emission data can be collected simultaneously with optional peripheral devices
Data analysis options: Analysis is most usually completed by comparing the force work done or distance ratios. Exponent not only provides macros that are ready to use to analyse your data, once your tests have been performed, but enables macros to be written that can quantify almost any aspect of the Force, Distance and Time data resulting from the test
Capability: The flexibility to perform such a wide range of sophisticated additional mathematical functions within the software is unrivalled
Charts: Select from chart type and define, position, legend styles, base and wall styles and axes types
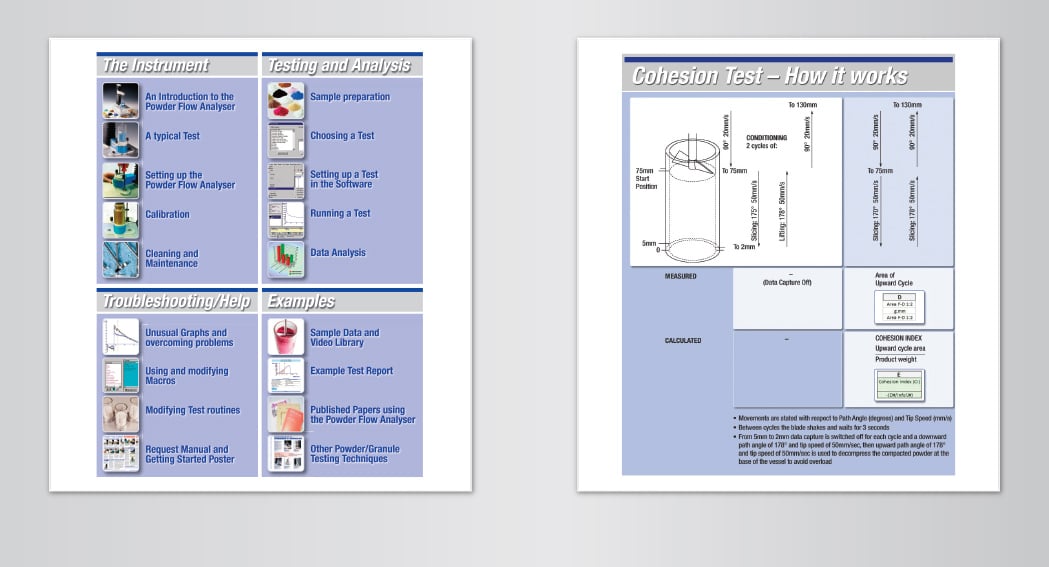
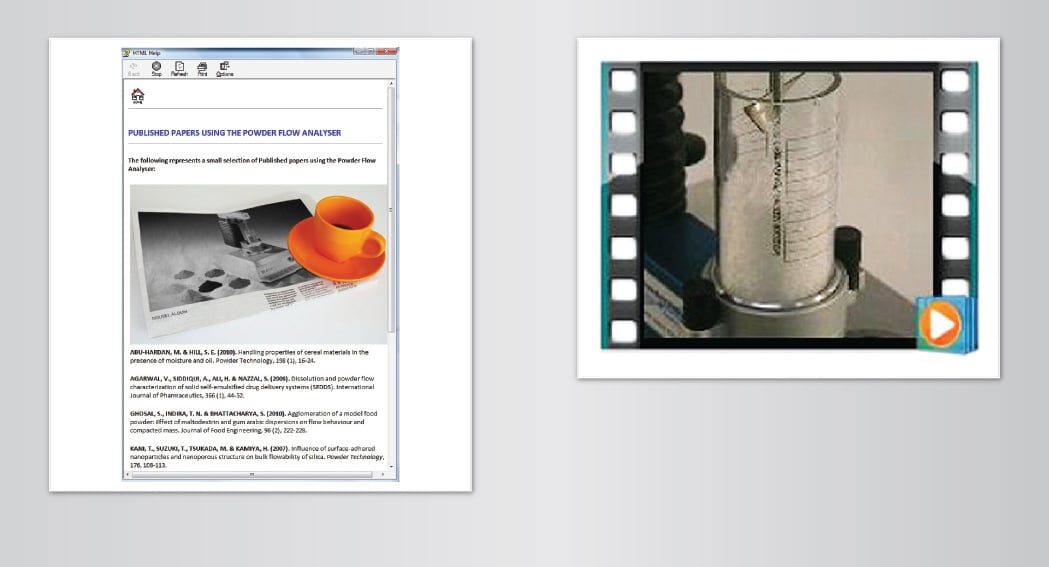
Help: Within the software and online, we're always trying to help. Help files are available to guide you through your testing and analysis and provide the background support material you need to get the best from your instrument. Each test explanation is enhanced to include videos of each test stage and an extensive database of videos on a wide range of powder samples is now included on DVD.
You can also read about other people's experiences and their data from the collection of published papers that have been written by users of the instrument.
Typical analysis
Almost any feature of a powder flow measurement can be recognised and recorded: peaks, intermediate threshold peaks, gradients, elapsed time and distance events, smooth and jagged line comparisons, and many other features.
Analytical macros can therefore be written to suit a particular test event, or a special characteristic of the samples.
Generally for a particular powder the Down Force work done (Compaction Coefficient), Up Force work done (Aeration Cohesion) and Distance Ratios provide excellent, repeatable measurements that allow presentation of the main powder characterisation parameters.
Test Settings and analysis Macro routines can be optimised to suit your particular applications and if routinely required they can then be saved as user-specific Projects.
Alternatively it is very easy for the user to write their own method for the particular analysis required.
So your tests are done - now let's make sense of it all...
Graphs
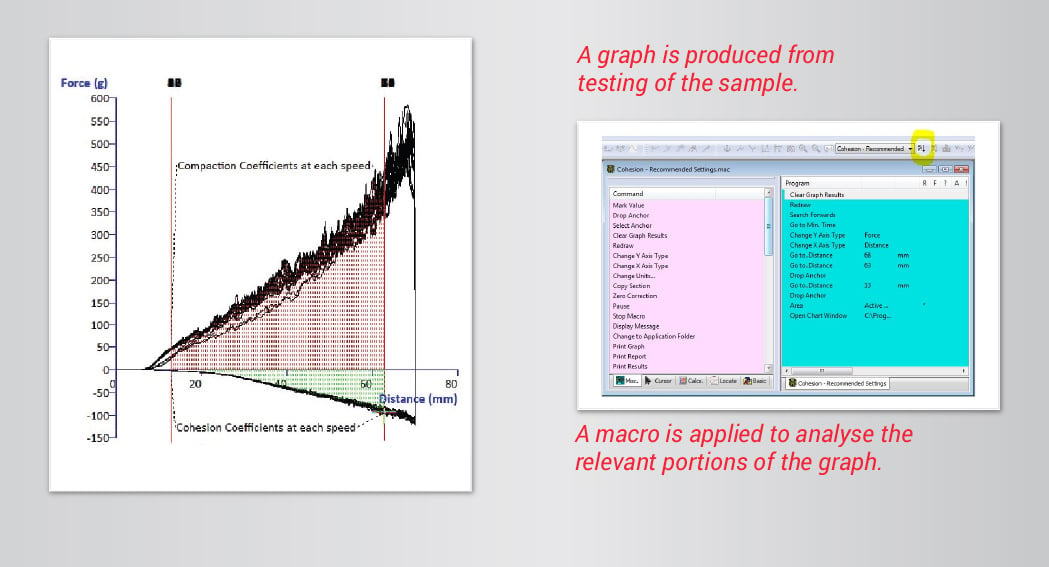
The Graph window displays the real-time data acquired during the test which can be annotated to highlight the areas of interest.

Graph windows are tabbed for easy access to all relevant archive file information.
Graph files can include photos of the sample that was tested. Graphs can also be exported as .bmp or .jpg
Long file names provide the ability to insert more detailed information which is useful when locating the test file for future viewing.
Macros
A Macro simplifies repetitive analysis and display.

A set of instructions are listed and executed which automatically collect data from the graph. Tests can be automated with either intricate or simple macros, which is ideally suited to a production environment.
Tabbed windows for groups of commands provide simplified listings.
Spreadsheets
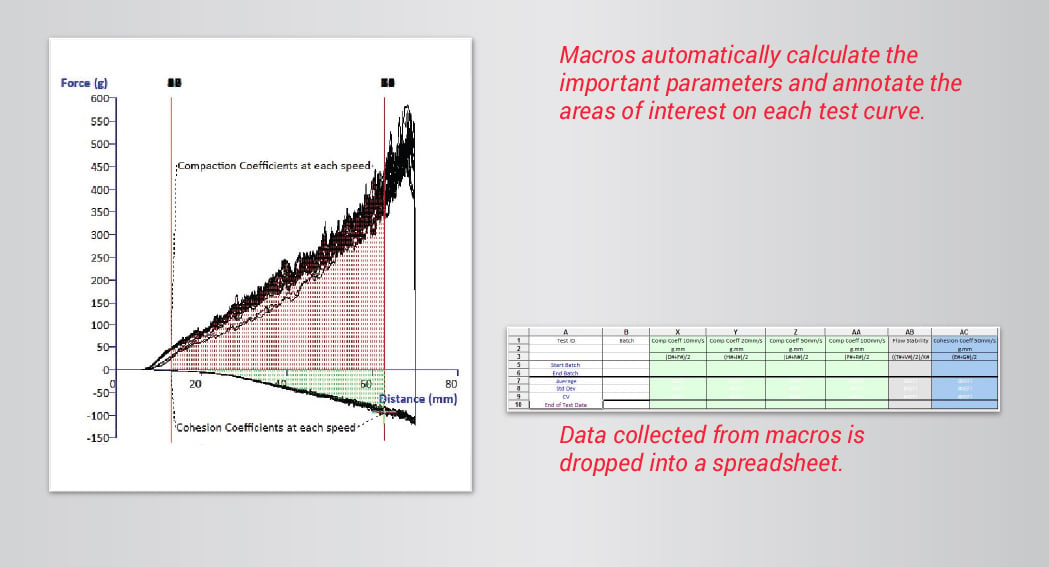
The analysed data is displayed in a results file and if necessary further calculations are made by the addition of more columns to produce other parameters.

The Results window tabulates results in customised spreadsheet format. Data can be manipulated using either your own or stored formulae e.g. Standard Deviation, Average. Multiple worksheets are available to separate parameters from results.
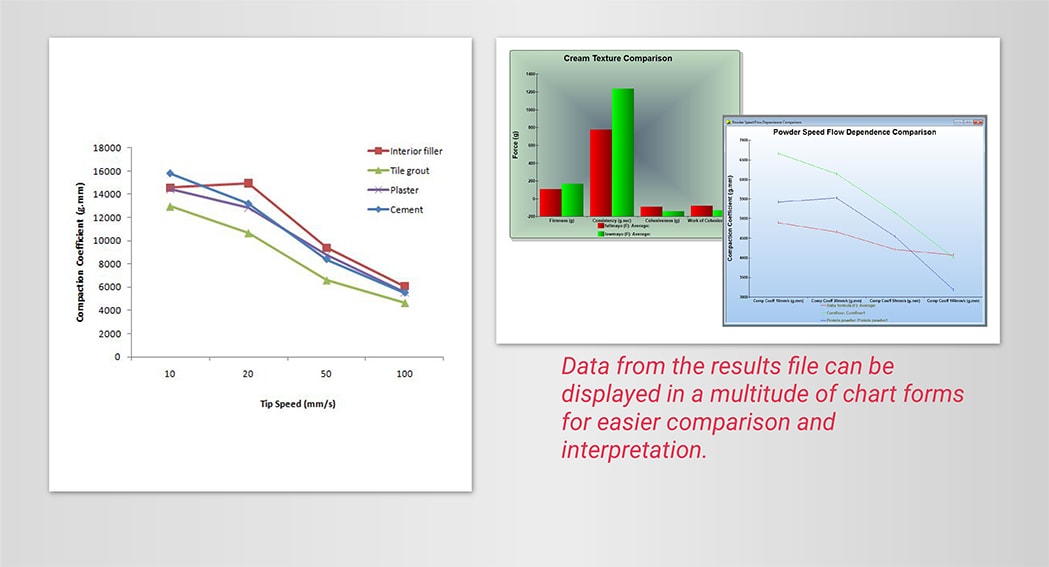
Charts
A chart gives a visual representation of the data from the Results window.
Select from chart types and define position, legend styles, base and wall styles and axes types.

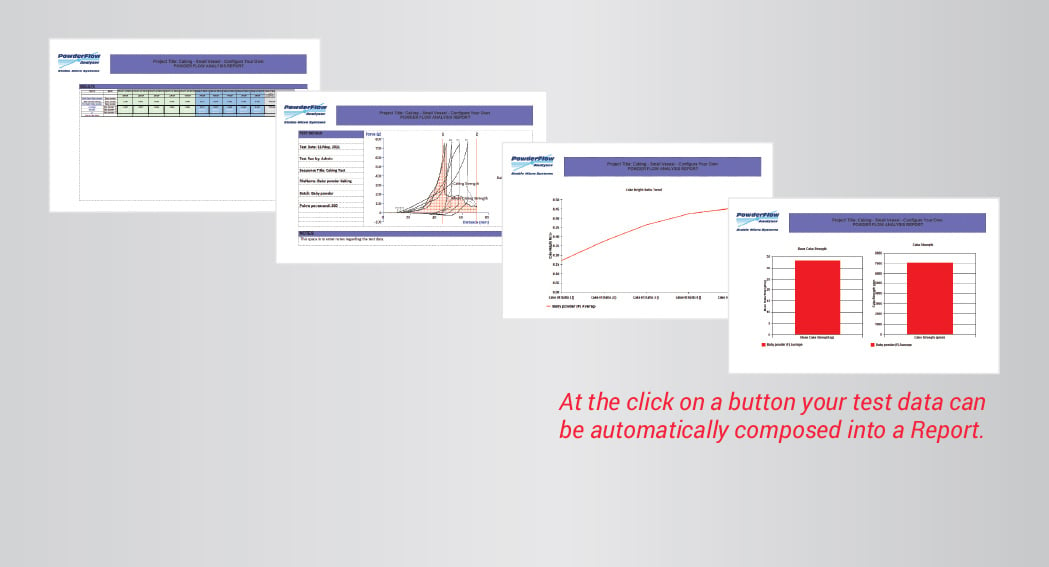
Reports

A Report is a user formatted presentation of the complete analysis incorporating Graph, Results, Chart windows, plus other data and graphics.
A WYSIWYG word processor type interface is incorporated with adjustable fonts and styles, Spell checker and Thesaurus. Objects (graphs, pictures, logos, etc.) can be inserted as a character or floating with selectable word wrap options. Test parameters are inserted as fields.
Reports have been improved to automatically display the important parameters calculated in a spreadsheet and present them in chart form.
Exporting Data
Spreadsheets, text or images can be exported to other Windows applications for further specific manipulation/presentation if required.
Calibration of the Powder Flow Analyser
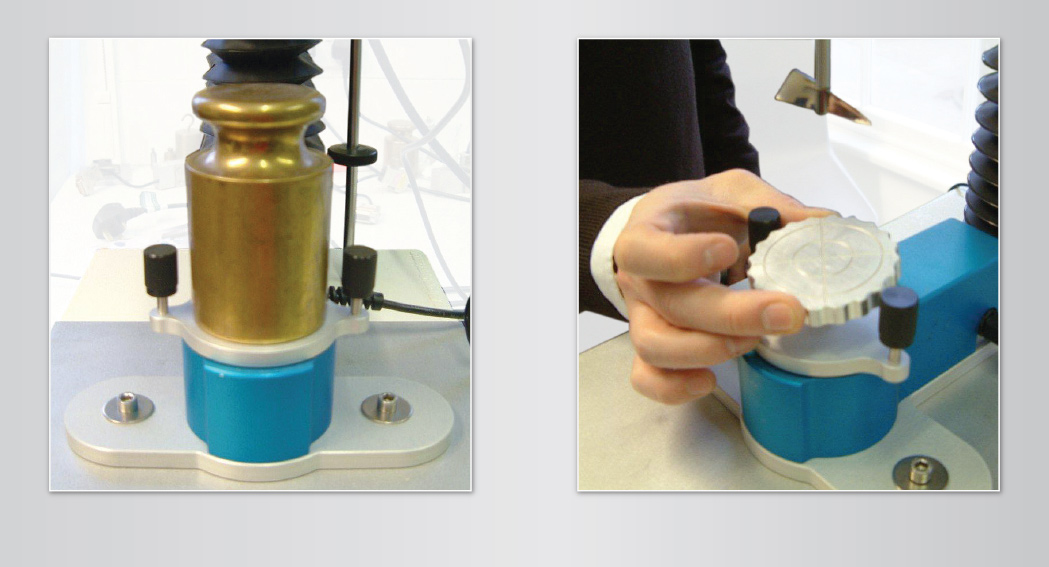
Calibration of both force and distance is carried out in-house at the end of the manufacturing process.
Customers can easily re-calibrate the instrument in their laboratories, depending upon their chosen best practice. The instrument's accuracy can easily be checked in terms of speed, distance and force measurements to meet the more demanding regulations of certain industries.
Once calibration is complete, you can perform your powder flow analysis with confidence that your cohesion, caking and powder flow speed dependence properties are being measured accurately.


 1
1 2
2 3
3 4
4 5
5 6
6 7
7 8
8


