How to measure texture and density of your gluten-free bakery products
 3 minute read
One of the biggest challenges in developing gluten-free products is creating an appealing texture that is not firmer or more dense than its gluten-loaded counterpart. Navigating this complex area requires a detailed understanding of the structural properties and composition of food formulations.
Gluten-free products have traditionally had unappealing textures such as dry, crumbly and gritty qualities all of which are perceived as unattractive textures. Other common issues in gluten-free bakery products include reduced volume, lack of an even cell structure, and reduced shelf life. This intimidating challenge to the cereal technologist and baker alike has led to the search for alternatives to gluten in the manufacture of gluten-free products that are able to mimic its unique properties mainly involving the incorporation of starches, different sources of protein and hydrocolloids.
The Texture Analyser is helping in development of these products. But there’s also the Volscan Profiler – a product that uses a laser to measure the volume and density of a product. Now just as the removal of an ingredient such as a gluten can affect the texture, so too might it affect the product’s density. The Volscan Profiler will thereby allow you to compare the increased or decreased volume or density to keep track of the changes that occur during reformulation which may negatively impact on consumer success.
Here are a few examples of gluten-free products that can be measured using the Texture Analyser and Volscan Profiler to keep objective control. Texture analysis shows that in this standard panini vs. gluten-free panini the difference in firmness that would be perceived by the consumer is considerable.

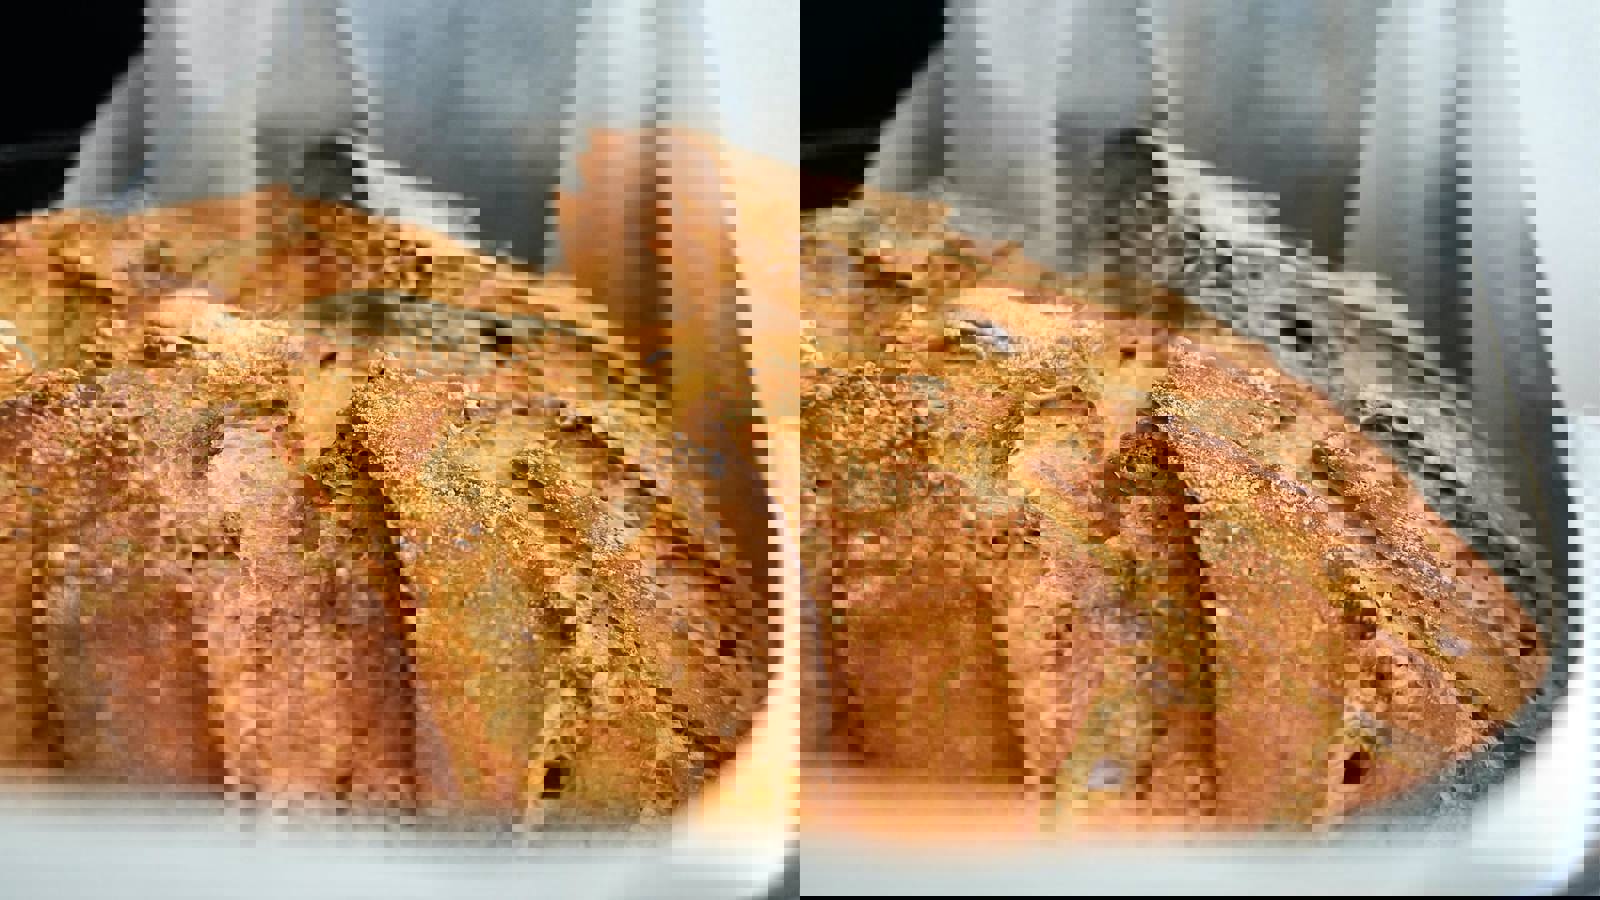
These paninis can be scanned using the Volscan Profiler to also confirm that density and volume have been impacted. The equivalent gluten-free panini is seen to have increased density and decreased volume.
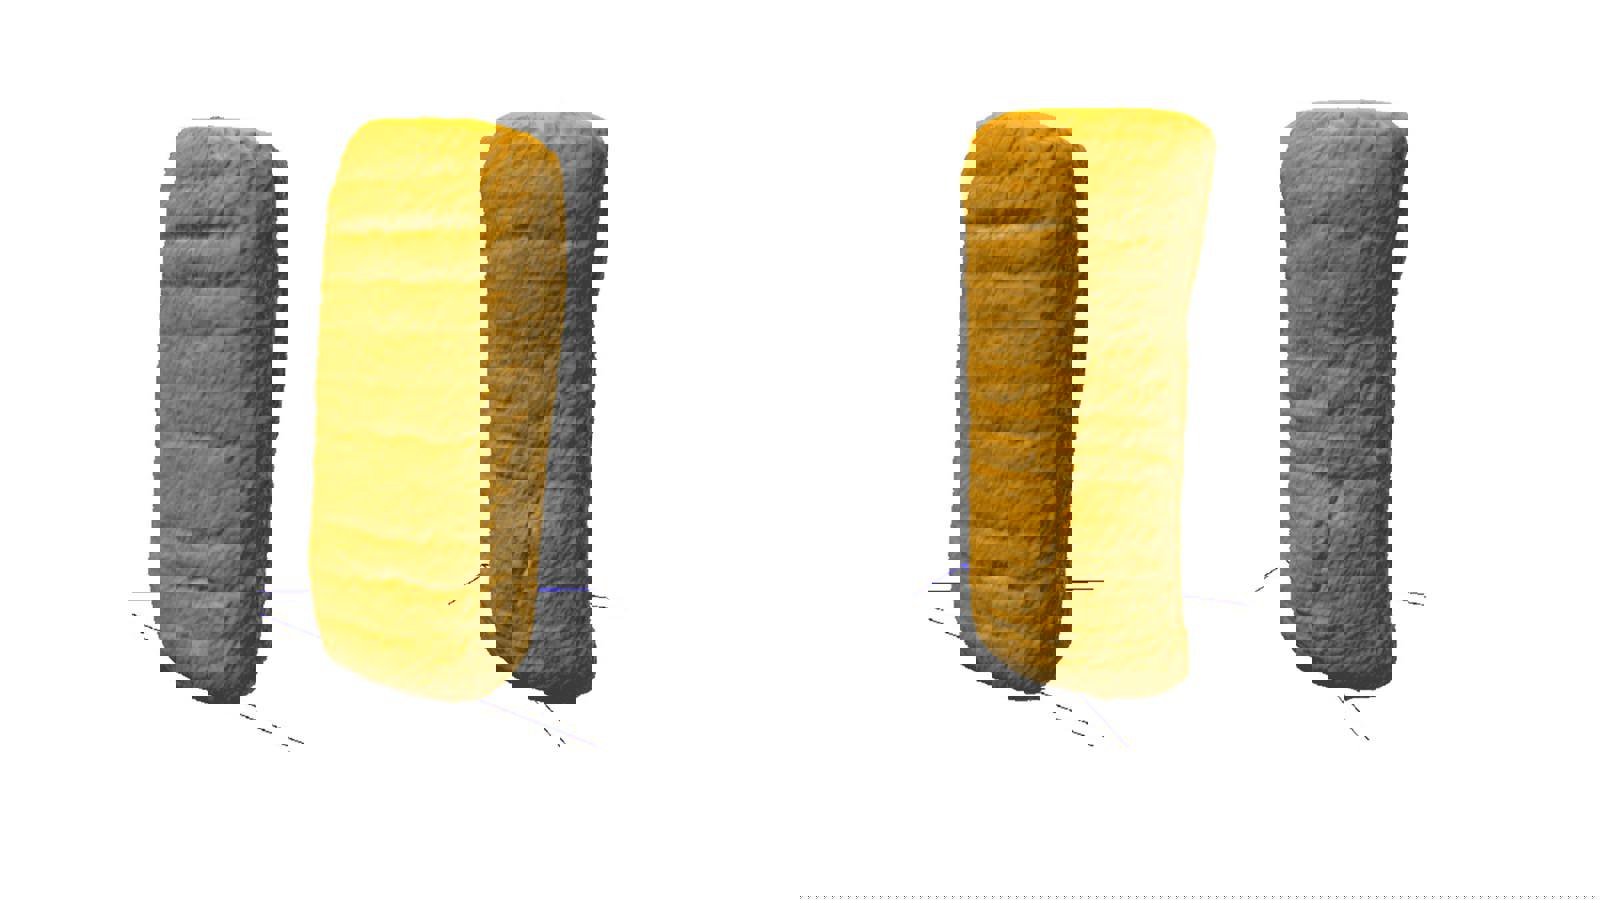
Conversely, when comparing two madeira cakes the gluten-free madeira is seen to have decreased density and increased volume compared to the standard madeira cake.
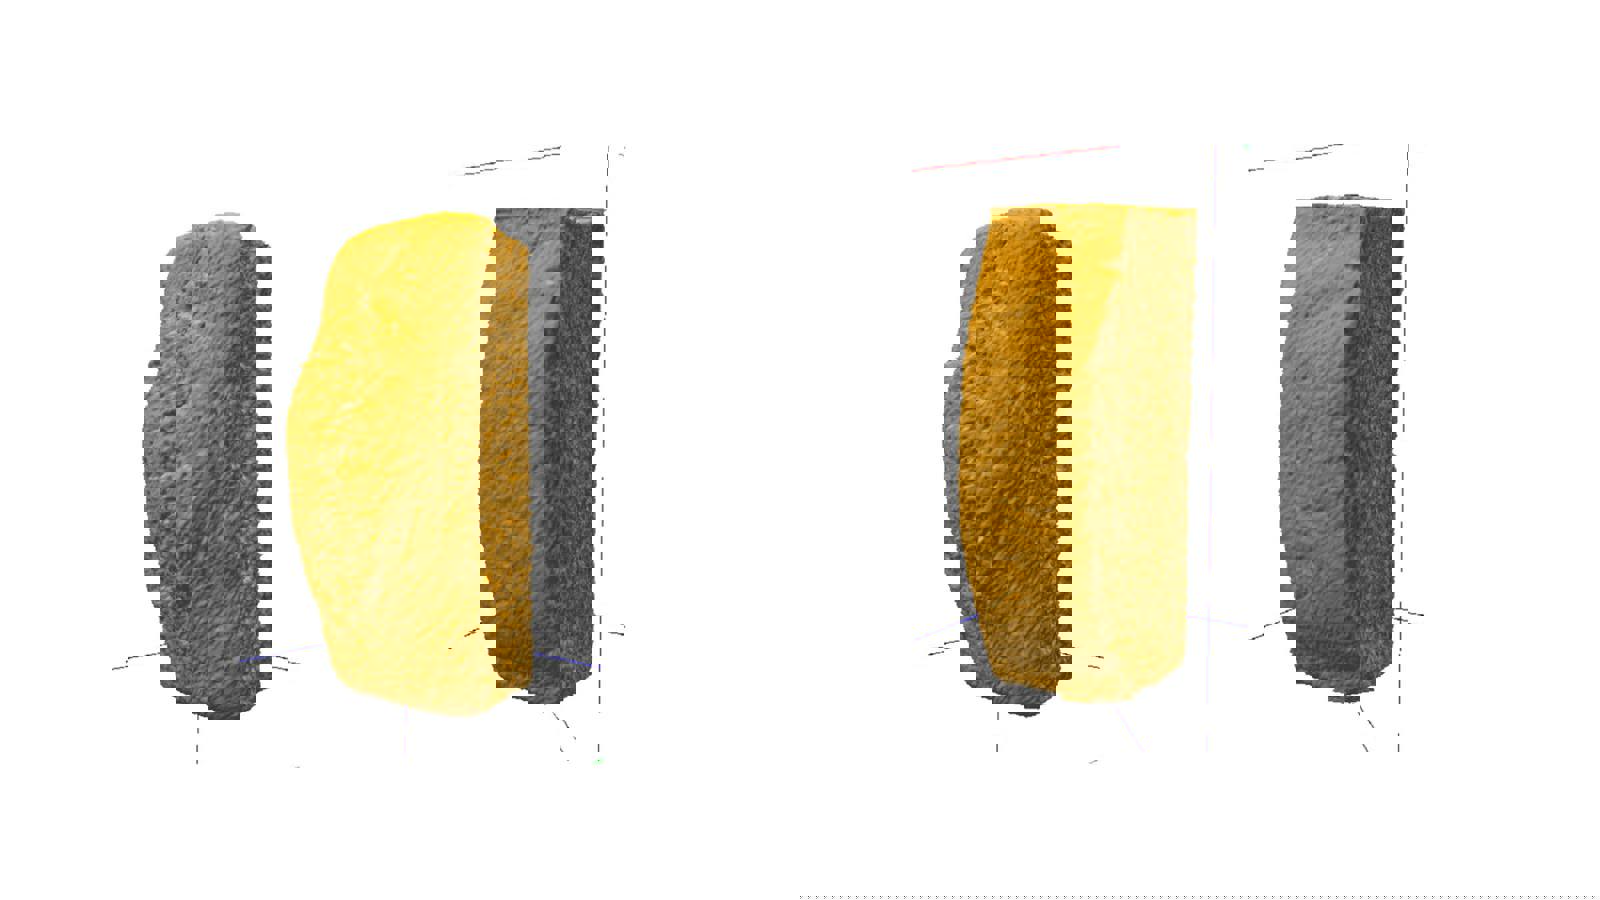
Whilst the texture is seemingly unaffected between both formulations:

Customers already embrace this gluten-free trend, but will only continue to do so if taste, texture and health remain uncompromised. Companies that can innovate to meet changing consumer expectations – while continuing to satisfy their senses – will see the greatest success.
How are the Texture Analyser and Volscan Profiler currently being applied together in academic research in gluten-free products?
Quality evaluation of cookies produced from wheat flour and brewer's malted barley flour
Germination of oat and quinoa and evaluation of the malts as gluten free baking ingredients
Linseed (Linum usitatissimum L.) mucilage as a novel structure forming agent in gluten-free bread
Further information
View published references on research using our instruments for bakery product testing
View patents that refer to our instruments for testing of bakery products
See how bakery industry leaders use texture analysis to get ahead of their competition